
Dewey Bubble!
Check out this cool data visualization of book borrowings! Click here to see an enlarged version of circulation statistics displayed as Dewey Blobs 🙂
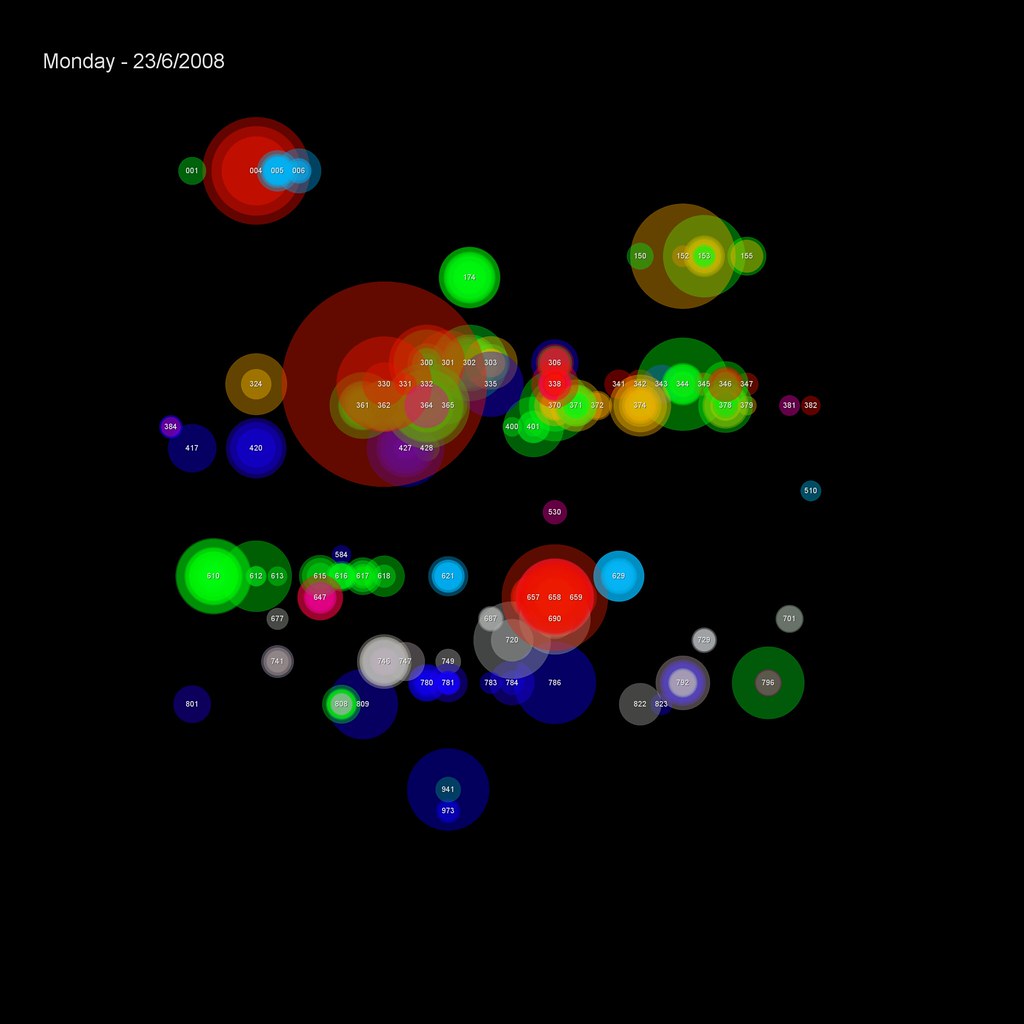
The transactions are placed on a 32×32 grid based on their Dewey classification (000-999). Each transaction is shown as a semi-transparent circle with two attributes:
1) colour — based on the School the student making the transaction studies in
2) size — based on the popularity of the book (the larger the circle, the more times it’s been borrowed before)
From Dewey Blobs at Dave Pattern’s “self-plagiarism is style”.

That is very cool, indeed! My library aide and I will have to play with this once we get back to school in September. Wouldn’t it just blow the Administrators and Board of Education away!